This week I gave a talk at the Plain Concepts Cloud Chapter about something that has been changing how I work on a daily basis: setting up agentic environments for cloud engineering work. Not demos, not toy examples. Real workflows, real infrastructure. This post is what I’d write the day after.
The infrastructure around us keeps growing. The processes we use to manage it, not so much. At some point you realize you’re spending more time on repetitive diagnosis, cost reviews, and policy checks than on actual engineering. That’s the problem I wanted to address.
Copilot vs agent — a real distinction
There’s a lot of noise around AI in software right now. Everything gets called a “copilot.” But there’s a meaningful difference between a tool that responds when you ask and one that acts autonomously.
A copilot amplifies what you already do. You ask, it helps. Useful. Familiar. Still centered on your manual input.
An agent goes further. Given a goal, it plans, calls tools, checks results, and iterates until it’s done. You’re not the bottleneck anymore. The agent can run while you’re doing something else.
That distinction matters in cloud engineering. A copilot helps you write Terraform. An agent validates that Terraform against your Azure policies, checks what would break, and tells you before you push. One requires your input at every step. The other completes the loop without it.
Two types of agents
Not all agents have the same operational surface. I split them into two categories that make sense in this context.
Assistive agents live next to you — in your IDE, terminal, or repo. They amplify individual capacity: writing, reviewing, executing bounded tasks. The tools here are GitHub Copilot (VS Code, JetBrains), Claude Code, Cursor, OpenCode, Continue. You’re still in the loop, but the loop is much faster.
Operational agents live on the platform — Azure AI Agent Service, Microsoft Foundry. They’re part of the system, not your personal toolbox. They have integrations, permissions, observability. An SRE agent that responds to alerts without you waking up. A FinOps agent that produces a cost report every Monday morning. Examples: SRE agent, FinOps agent, governance automation.
The difference is scale. Assistive agents scale you. Operational agents scale the team.
What’s inside an agent
An agent is four things working together:
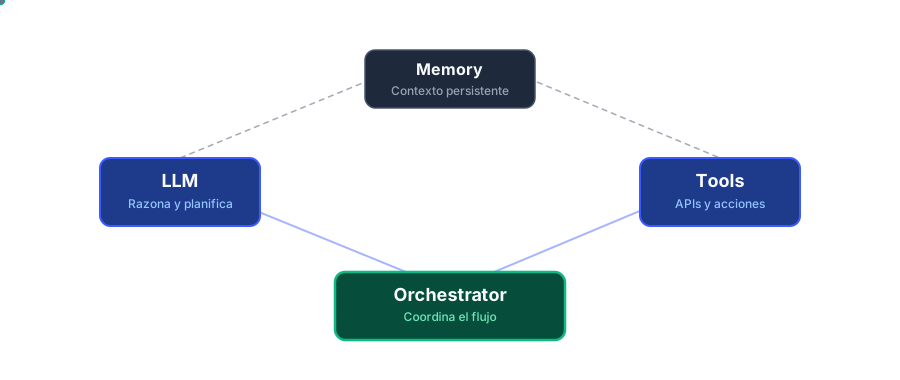
- LLM — the reasoning engine. Claude Sonnet 4, GPT-5, Gemini 2.5 Pro. All accessible via GitHub Copilot in the ecosystem we use.
- Tools — what the agent can actually do. Call an API, read a file, run a query, write to a database.
- Memory — context that persists beyond a single conversation. What it already knows about your infrastructure, previous decisions, current state.
- Orchestrator — the loop that decides what to do next given the current state and goal.
None of those components is new. What changed is that MCP made wiring them up to real systems much less painful.
The piece that makes it work: MCP
Model Context Protocol is the standard that changed everything in this space. Anthropic created it, and Microsoft, Google, and OpenAI adopted it fast enough that it’s now the de facto way to connect an LLM to external tools.
The idea is simple: an MCP server exposes a set of functions. The agent calls them. It doesn’t care whether it’s talking to Azure Monitor or a GitHub repo — it just calls the function and reads the result.
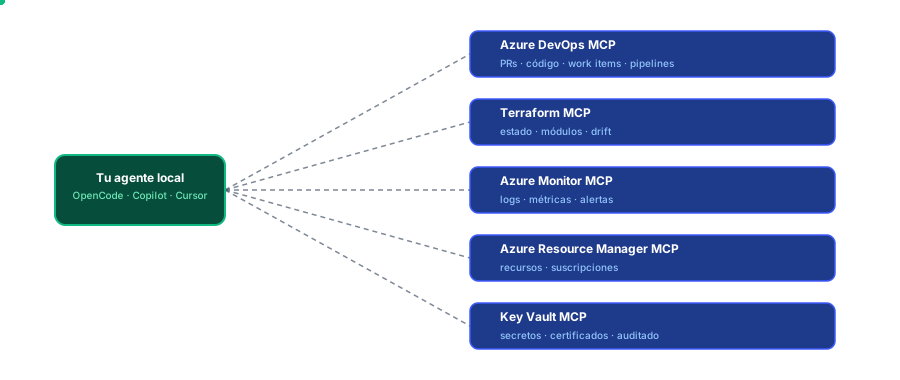
For cloud engineering, the useful MCP servers are the ones that connect to Azure: Azure Resource Manager, Azure Monitor, Azure DevOps, GitHub, Key Vault. Once those are wired up, an agent can read your infrastructure state, query logs, check costs, and inspect policies without you mediating every step.
That’s what an agentic environment actually is: your tools, your repos, your cloud — connected to an LLM that can reason over all of it at once.
The demo infrastructure I used for the talk is the same event-driven app from a previous post — an order processing system on Azure using Service Bus, Azure Functions, Cosmos DB, and Container Apps. I reused it because it gave me three agents operating on something real: a running app, live metrics, actual cost data, deployed Terraform.
Case 1: SRE — incident diagnosis without the 20-minute chase
The classic SRE problem: an alert fires. You open App Insights, find the timeframe, correlate with logs, check which service threw first, figure out whether it’s a dependency issue or something internal. Fifteen or twenty minutes if you’re fast.
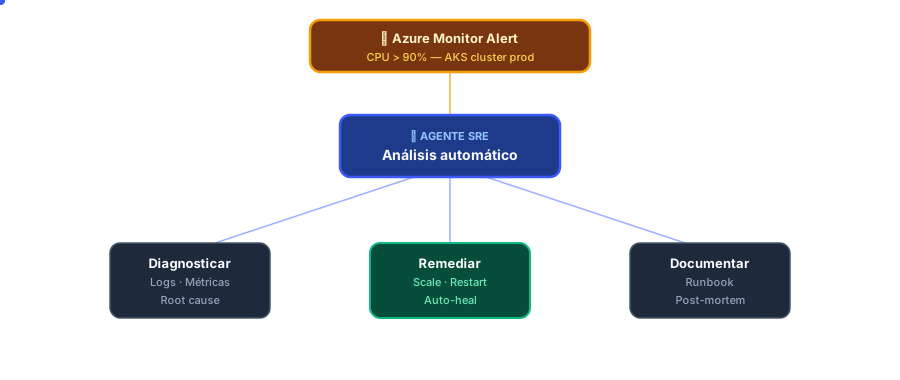
During the talk I showed this live: “What’s failing in the app?” — and let the agent work.
It read the repo to understand the architecture. Checked Application Insights for recent exceptions. Found 733 CosmosHttpResponseError (BadRequest) errors in billing-fn over 24 hours. Pulled the code from the Function and the state management module. Spotted the mismatch in seconds:
# what Cosmos DB expected (from order-api/state.py)
{"status": {"billing": "pending", ...}}

# what billing-fn was patching
{"op": "replace", "path": "/billing_state/billing", "value": status}
#                                ^^^^^^^^^^^^
#                         path doesn't exist in the document
Root cause identified. The patch path was wrong. Seven messages were sitting in the Dead Letter Queue for billing-sub. Inventory and notification subscriptions were unaffected — exactly what the EDA isolation promises.
What made it fast wasn’t the agent guessing. It was the agent reading the actual code and the actual logs together, in context, without me navigating between tabs to assemble the picture manually.
Case 2: FinOps — a cost report you can act on
The FinOps case is different. Not an incident, not urgent. But it compounds silently.
The ask was simple: “How much does this cost us?” Not “here’s the Azure Cost Management report.” An actual structured analysis — what runs, what it costs, where we’re wasting money.
The agent inventoried all resources in the resource group, pulled real pricing for each SKU, analyzed actual usage patterns from the last 30 days, and crossed that with Azure Advisor recommendations. Then it wrote a report.
The infrastructure costs around €64/month in steady state. The interesting part was what it found:
- The three Azure Functions are on B1 App Service Plans. Combined: €33.95/month.
- Actual usage in 30 days: billing-fn ran 27 times. Inventory and notification similar.
- That’s Consumption Plan territory. Estimated saving: 67–78%.
The agent didn’t just report the cost. It explained why those resources were over-provisioned for the actual load, what the alternative was, and what the tradeoff would be in cold-start latency. That’s the difference between a dashboard and an analysis.
Case 3: governance — shift left before the apply fails
This is the one that saves the most frustration. Anyone who’s worked with Azure Policy knows the pattern: you write Terraform, open a PR, the plan passes, you apply, and then it fails because a policy blocks the resource configuration. Sometimes hours into a review process.
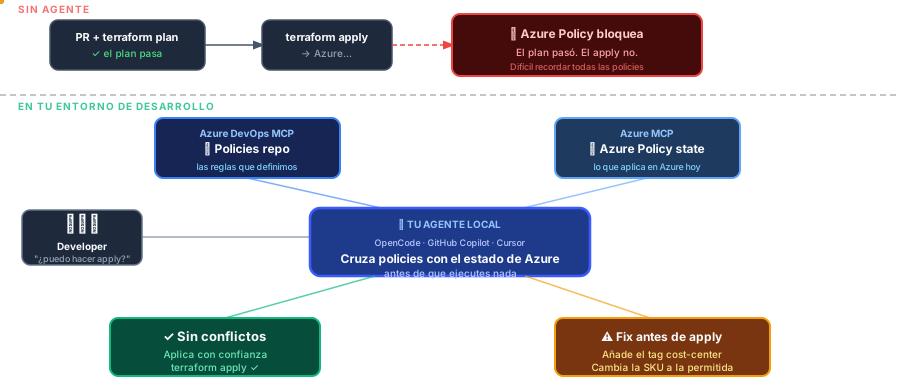
The fix is moving that check earlier. Before the push.
The agent reads the policies assigned to the subscription — the actual policy definitions from Azure, not a static checklist. It reads the Terraform plan. It reasons over both and tells you what would fail and why.
During the demo I showed a module trying to deploy a storage account without enforcing HTTPS. The agent caught it, explained which policy it violated, and suggested the fix. The apply would have failed at that exact parameter. Instead it failed in the terminal before I’d even opened a PR.
That’s what shift left actually looks like. Not a linter. Not a checklist in a wiki. An agent that understands both your code and your cloud environment at the same time.
What I took away from building this
The infrastructure for these demos took real time to wire up. Terraform modules, Managed Identities with the right RBAC scope, Application Insights properly linked, MCP servers configured in the IDE. None of it was hard, but all of it was necessary. You can’t have a useful SRE agent if it can’t read your logs. You can’t have a FinOps agent if it can’t query real pricing.
The setup cost is front-loaded. Once it’s in place, the operational leverage is real.
The other thing I’d flag: the EDA isolation held up under actual failure. When billing-fn was broken, inventory and notification kept processing their own copies of the event from their own subscriptions. Seven messages in the DLQ, zero in the others. That’s the architecture working as designed, and it’s visible in the kind of incident report an agent can generate — because the data is there in App Insights, separated by subscription and correlation ID.
The full infrastructure is Terraform, the demo app is Python on Azure Functions and Container Apps, and the talks are part of an ongoing series. Next sessions cover MCP deep dive and SRE automation patterns.
If you want to look at the actual code for the EDA app that powers these demos: Kerman-Sanjuan/event-driven-acl.